Materials Modeling Group
Services to guide your processes and minimize chances of failure.
The focus in the Materials Modeling Group at Triclinic Labs is utilization of the maximum information content present in a broad range of analytical data collected on common laboratory instrumentation using minimal material. The information and analysis capabilities of the group are used to guide product development, modify processes, improve materials properties, and predict product failure.
We accomplish this through optimization of instrument configurations, novel analytical techniques, and a combination of both ‘off the shelf’ and proprietary analytical software. A key capability of the Materials Modeling Group is the expertise required to perform and optimize the analysis methods required for the specific materials being analyzed and the analytical tools used to collect the data.
Here are some examples of real-world applications arising from the Materials Modeling Group's capabilities:
Ask Our Scientists!
Request More Info
Prediction of Stability in Non-Crystalline Systems:
Characterizing the amorphous state through measurement of relaxation times, heat capacity, residual water/solvent content, and other characteristics can provide key information for predicting the timescale and temperature/humidity conditions for unacceptable degradation or crystallization.
If instability is introduced by processing, it should be determined if instability is caused by amorphous or disordered crystalline material and processing steps that introduce disorder can be eliminated or modified to achieve a more stable ASD.
To address the challenges when developing non-crystalline/amorphous materials and to provide tools to more effectively guide development, Triclinic Labs has developed a comprehensive approach to ASD materials characterization and analysis that can be broadly divided into three categories:
1.) Total Diffraction Modelling allowing direct ranking of relative physical stability for amorphous solid forms.
Non-crystalline and amorphous solid forms can exist in a broad range of physical states depending on thermal history and the production processes used to make the material. When manufacturing amorphous solid forms, a common challenge is how to select the appropriate production process and thermal annealing to maximize physical stability. Using a new total diffraction modelling approach for X-ray powder diffraction (XRPD) data, we are able to determine the inherent inter-molecular order that characterizes individual amorphous solid forms. This new capability has revealed that more stable non-crystalline states (when compared to less stable solid states) exhibit a characteristic change in the observed local order.
For more stable non-crystalline solid states (compared to less stable non-crystalline states of the same system), the XRPD analysis method developed at Triclinic reveals an increase in the local packing density combined with a reduction in residual order length scales.
2.) Total Diffraction Chemometric Variance Analysis for formulation optimization.
In addition to the choice of production process and thermal annealing steps, the choice of formulation methodology and excipients will also be critical to the physical stability of the final product or intermediate. At Triclinic Labs we have found that the combination of Total Diffraction data with Chemometric variance analysis is a powerful tool for teasing out the influence of excipients and formulation on the local state of the amorphous API and the potential for long-term stability issues. The Chemometric approach has also been used to characterize the impact of residual water and solvents within formulated products.
3.) Multidisciplinary Humidity-Temperature Transformation over Time Modeling.
Structural relationships within amorphous solid forms carry critical information on inherent physical stability. When combined with a multidisciplinary approach to solid form characterization under variable humidity and temperature conditions, the orthogonal information can be used to construct a transformation model for the amorphous form. The derived transformation model allows prediction of physical changes occurring within an amorphous solid form over a wide range of storage conditions. Physical properties captured by the transformation model include (for example): phase separation, collapse, flow and crystallization. Confidently guide your amorphous product development!
The major benefit of the new analytical approaches described above is a straightforward methodology that can be used to not only rank order non-crystalline forms produced by different production methods but also fine tune the formulated product.
For robust characterization of amorphous materials, a combined analytical approach using spectroscopic, thermal and diffraction methods is the preferred approach. With recent advances in characterization software, considerably more information can now be extracted from amorphous materials using diffraction techniques than was previously possible. Characterization of the local molecular short-range order using X-ray powder diffraction data provides unique insight into single phase and multi component amorphous systems that is often directly related to the physical and chemical stability of the amorphous system.
The results are robust enough that the ideal formulations and production methods to achieve enhanced physical stability can be identified without extensive aging studies. In fact, accelerated aging studies can modify the local order within a non-crystalline formulation and give non-representative results with respect to physical/chemical stability. These non-representative results can be misleading unless built within a more comprehensive transformation model.
The methodology above has been proven with exiting pharmaceutical amorphous formulations (e.g. hot melt extrusion, spray drying) and has allowed clients to guide their production and regulatory strategies. See the Case Study below.
Guidance in Manufacturing, Optimizing results.
We've developed the concept of a "production screen" at Triclinic Labs and reduced it to practice. The approach involves subjecting actives and active combinations (excipients) to stresses typically seen in a production environment but well before the material is made at scale. Examples of these stress systems are heat, mechanical, oxidative, hygroscopic, and pressure. Data from these conditions is collected on our instruments and the effects are modeled to determine what factors would have a negative impact on the system. We can model each of the stressors shown below and provide feedback for development. We can also identify issues if asked to trouble shoot.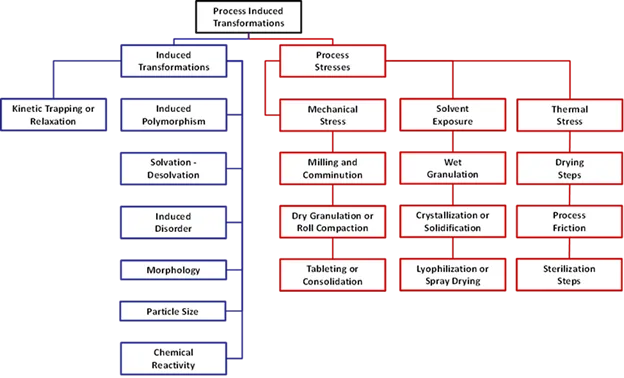
Figure 1. Chart of posible mechanical, thermal, and process induced stressors which may impact formulations.
Modification of Formulation Conditions in Silico
CASE STUDY:
Based on a Time-Temperature-Transformation studies done in our labs, the physical stability of a client’s amorphous formulation was predicted to be greater than 100’s of years at ambient storage conditions. When the product crystallized during ambient storage, it was postulated that there was nothing wrong with the formulation but that there was heterogeneous nucleation in the system. Since the amorphous formulation was manufactured by hot melt extrusion, Triclinic recommended that the client increase the hot melt extrusion temperature slightly (based on the melting point of the API and interconversion studies) to remove any nucleation seeds. The client increased the holt melt temperature by 5C which was allowed within their processing guidelines. This resulted in a stable formulation. The resulting product was predicted to be stable over millennia. Upon further investigation, the failed product was found to be from a scale up process at smaller scale compared to the commercial hot melt extrusion process. At the same temperature, the larger process was not as effective in removing all crystalline seeds as seen in the smaller scale. Without the TTT information, the client would not have been able to resolve the issue easily.Quantitative Solid Mixture Method Development
A multi-phase mixture, will show more than one pattern, allowing for determination of the relative concentrations of phases in the mixture.Quantitative method development continues to be a required aspect of drug development. Solid-state assays, such as the determination of polymorphic (phase) purity or amorphous/crystalline content. For solid-state systems the impact of the sample matrix must be accounted for during method development. The ICH Q2 guideline functions well for quantitative method development when matrix effects are not observed (e.g. an ideal powder or ideal liquid system). However, for most solid-state assays, matrix effects can be problematic. Matrix effects are usually driven by variables such as particle size, inhomogeneous mixtures, preferred orientation, absorption effects, and density differences between components. The extent and diversity of these effects vary between different analytical techniques.
The largest source of matrix effect error is often the standard samples themselves which are used to develop the calibration curve or model. Ideally, calibration samples for any drug product assay are generated by the actual production process used to produce the drug product. This approach will typically manifest far less matrix error than the artificial, laboratory-generated standard mixtures. Specific matrix effects can be random in nature and can be driven by mixing and sample preparation or may occur only for specific concentration ranges and mixtures. Matrix effects driven by particle-size differences between components or absorption differences, for example, are often systematic in nature while crystalline orientation effects often appear as specific matrix effects.
Recognizing that the difference in matrix effects between artificial standard mixtures and the actual drug product may be the largest source of error for a solid-state quantitative method, Triclinic Labs has developed a novel approach for drug product based semi-quantitative methods. These “standard-less” semiquantitative methods make use of correlated variance in raw analytical response with known drug product variance (Chemometrics) as the analytical methodology. Typically, these methods are robust and can be transferred between laboratories making them ideal for drug product characterization.
Combined Reflection and Transmission X-ray Measurements for X-ray Powder Patterns free of Preferred Orientation.
For quantitative and semi-quantitative analysis using diffracted X-ray intensity, preferred orientation of crystals within a powder sample can be one of the most significant sources of error. If the preferred orientation is severe, then phase (polymorph) identification can also be impacted. The combined reflection/transmission X-ray powder diffraction (XRPD) method developed on the Rigaku SmartLab system at Triclinic labs, is able is remove the impact of preferred orientation on measured XRPD peak intensities giving enhanced robustness for quantitative methods.
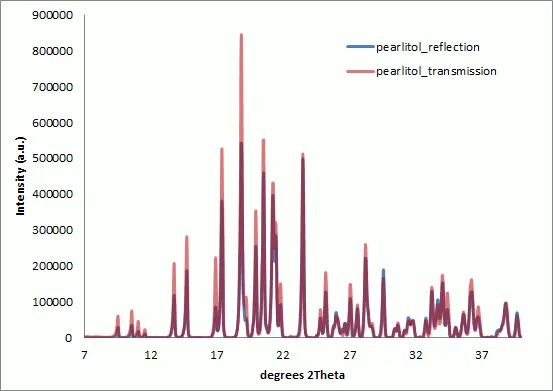
Figure 2 : Overlay of Pearlitol XRPD patterns collected in reflection and transmission modes. Data has been preprocessed and scaled to match the peak intensity at 40 degrees 2Theta. The instrumental intensity correction has not been applied. The transmission data gives relatively higher diffraction intensities at low angles with respect to the reflection geometry.
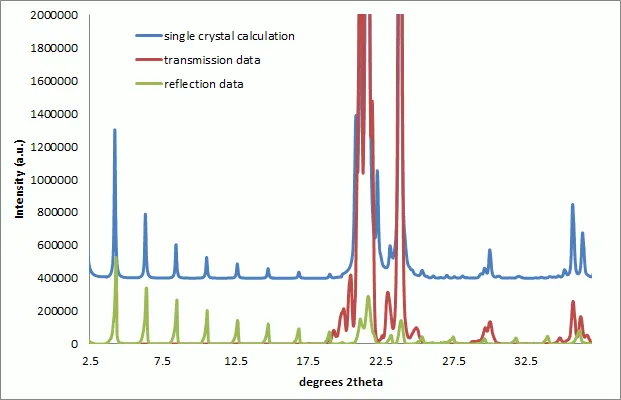
Figure 3 : Overlay of Pearlitol XRPD patterns collected in reflection and transmission modes. Data has been preprocessed and corrected for differences in the instrumental intensity response functions. The calculated single crystal powder pattern has been displayed displaced in intensity for ease of comparison. The combined reflection and transmission data provide a close match to the calculated pattern.
Digital Filtering to Minimize Random Variance
Usually the raw XRPD data is made up of diffractions from wanted and unwanted wavelengths, plus scattering and florescence from sample and sample holder. Therefore, we need to pre-process the data in order to minimize random or systemic variance.
The general procedures we used for pre-treatment of XRPD data includes: background removal, data smoothing (Savitzky-Golay filter is commonly used for diffraction profiles scanned on Bragg-Brentano diffractometer), offset adjustment and binning (reducing the number of data points).
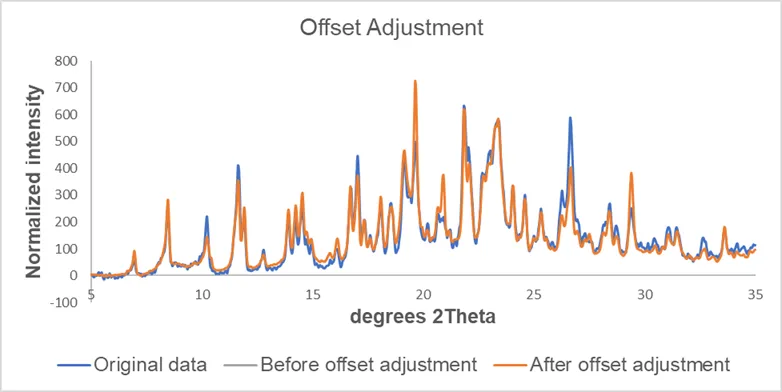
Figure 4. Effect of background removal, smoothing and offset adjustment on the data.
Phase Determination
Habit Modeling and Prediction
Please contact us for the latest information and capabilities.Rietveld Analysis
We routinely perform Rietveld analysis for both semi-quantitative mixture analysis and materials property characterization. The property characterization covers structural properties (e.g. unit cell parameters), micro-structural properties (e.g. crystallite size and micro-strain) and macro-structural properties (e.g. preferred orientation). For a given initial crystal structure we also routinely study molecular conformation and orientation modifications, changes in solvent (hydration) state and salt versus co-crystal issues. We are able to carry ab-inito studies, but we usually recommend trying single crystal analysis or synchrotron X-ray powder diffraction as the preferred methods. Routine semi-quantitative analysis using the Rietveld method ideally requires that all crystalline components are identified and that a reference single crystal structure is available for each phase. For custom methods, we are able to work with non-crystalline phases and unknown crystalline forms.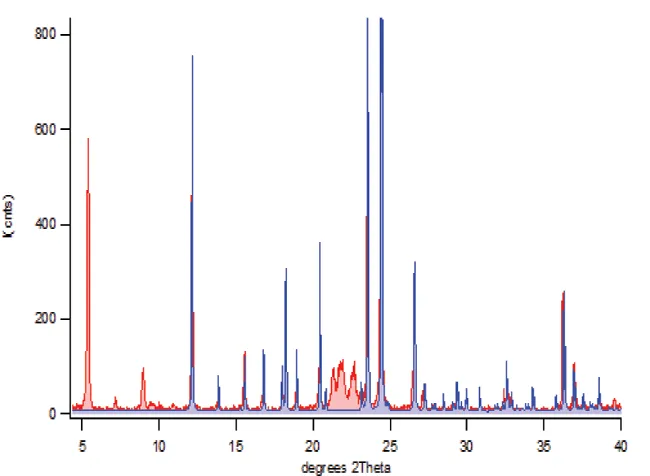
Figure 5. Rietveld semi-quantitative analysis of complex mixed powder patterns enables the extraction of the raw scattering intensity from each component and can handle (for the most part) the effects of changes in micro-structure like preferred orientation. In the two-phase binary powder pattern above, Rietveld semi-quantitative refinement of texture parameters and scale factors is performed on only one of the phases; acetaminophen shown in blue. The acetaminophen pattern was built using scratch-mode without an input crystal structure.
Indexing
We can offer unit cell indexing (unit cell and space group). As part of the indexing we can perform a Rietveld ‘scratch’ refinement. This Rietveld approach uses a random electron density cloud to model the peak intensities. While this does not include a full structural solution, it does verify that the correct space group is assigned. For single phase crystal structures that are not triclinic, our success rate for indexing is high (>90%). For complex triclinic structures (large unit cells and multiple molecules in the asymmetric unit) the success rate drops to around 50% to 60%.
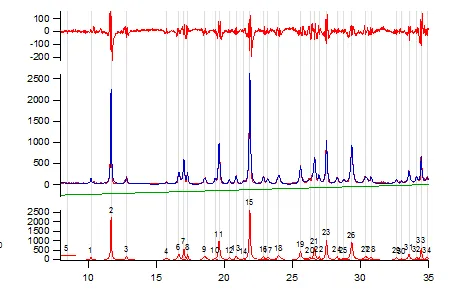
Figure 6. Powder pattern for gamma indomethacin collected on ~ 10mg of material. Full pattern peak fitting used to extract the optimum peak list from a measured powder pattern (Table 1). Peak positions can be used to index the powder pattern and give Miller indices as presented in Table 1.
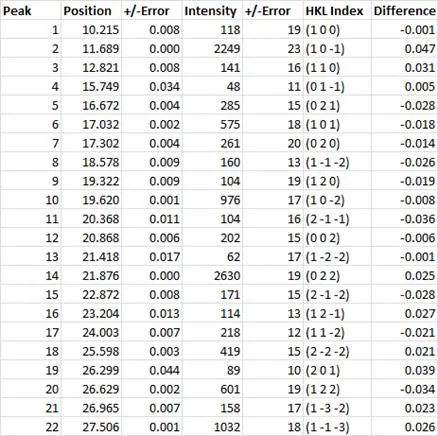
Table 1: Table shows peak position in 2Theta along with the peak intensity in counts. Each of these experimental observables are displayed with the determined uncertainties. After indexing, the Miller indices of the crystalline planes can be assigned to each of the observed peaks. Unit cell refinement then returns the ‘best’ unit cell parameters to describe the measured indomethacin powder pattern ( a=9.300(14), b=10.983(17), c=9.755(19), alpha=69.41 (12), beta=110.83(12), gamma=92.73(15)). The final column presents the difference between the observed and calculated peak positions in 2Theta. For the majority of the peaks in the table above, the difference between the calculated and measured peak positions is effectively the measurement step size (0.02 degrees 2Theta).
Advanced Analysis of Lyophile Cakes:
Much of the discussion in the previous section on the analysis of amorphous materials and dispersions is directly applicable to the characterization of lyophiles. Ideally, a lyophile cake will be a multicomponent X-ray amorphous system. The same in-house analytical software used to characterize the short-range order in dispersions can be used to probe the molecular order in occurring within a lyophile cake. For large organic molecules the length-scale coherently probed by X-ray diffraction for X-ray amorphous materials is relatively short range and will only give information on specific and commonly occurring functional group to functional group interactions.
Many of the chemical instabilities found in organic molecules are driven by these same specific functional group to functional group interactions. Various solid-state spectroscopic techniques can also be tuned to specific functional group interactions and can provide vital information on potential chemical instabilities within lyophile cakes. One area where the application of solid-state characterization to lyophile cakes has allowed improvement and optimization of the lyophilization process is in the determination of the nature of the residual water remaining within the final cake. The existence of free-standing water within the cake can be readily identified and quantified through X-ray powder diffraction analysis. Free-standing water is here defined as water existing in puddles/lakes of about 10 Angstroms or greater in dimension. That is a few hundred water molecules acting as a single body (there may be bonding with non-water components on the boundaries of the free-standing regions). Cross calibration of the total water concentration (from KF or any other suitable technique) with the free-water concentration from X-ray powder diffraction allows an estimation to be made of the bound to free-water ratio for any lyophilization process.
The solid-state characterization of the nature of the water content can be further refined by introducing thermal analysis (DSC/TGA) and molecular spectroscopy. IR spectroscopy in particular is very sensitive to the presence of water and any molecular bonding the water may undergo. The spectroscopic methods can be fine-tuned for specific water-non-water molecular interactions or may be used as a fingerprint to differentiate desirable from non-desirable water contents. The thermal methods may in combination with the X-ray powder diffraction can further refine the bound to free water characterization and can begin to differentiate between types of water bonding if required. The characterization of the free to bound-water relationships and the types of water binding can provide unique insight into the fine tuning of a lyophilization process to reduce the residual water as low as possible without causing loss of function for the active molecule.