Spectroscopy
Spectroscopy provides a precise analytical method for finding the constituents in materials having unknown chemical composition and/or location. Emission spectroscopy, uses some means to excite the sample of interest (e.g. laser excitation). After the atoms or molecules are excited, they will relax to lower energy levels, emitting radiation corresponding to the energy differences between the various energy levels of the quantum system. The emission lines will have a characteristic “fingerprint” that can be associated with a unique atom, ion, or molecule and is ideal for identification and spacial location.
What's it good for?
- Drug Product Failure Analysis (Location and Identification)
- Contaminant Identification
- Chemical, Physical, and Spacial distribution information of a sample
- Differentiation of Polymorphic Forms (Identification and Quantification)
- Innovator and Generic Product Comparisons (Spacial and Chemical)
- Proving or Disproving Infringement
We offer a wide variety of both cGMP and non GMP spectroscopic testing services.
RAMAN Spectroscopy -
Identify molecules, study chemical bonding, spatially locate chemicals
| Application AND Technique Description | ||
|---|---|---|
|
Raman is a non destructive spectroscopic technique used to observe vibrational, rotational, and other
low-frequency modes in a system. It provides provides detailed information about chemical structure,
phase and polymorphy, crystallinity and molecular interactions.
Raman spectroscopy is commonly used in chemistry to provide a structural fingerprint by which molecules can be identified. A sample is illuminated with a laser beam. Electromagnetic radiation from the illuminated spot is collected with a lens and sent through a monochromator. Elastic scattered radiation at the wavelength corresponding to the laser line (Rayleigh scattering) is filtered out by either a notch filter, edge pass filter, or a band pass filter, while the rest of the collected light is dispersed onto a detector. We specialize in hyper-spectral imaging or chemical imaging, in which thousands of Raman spectra are acquired from all over the field of view. The data can then be used to generate images showing the location and amount of different components. Raman spectroscopy is suitable for the microscopic examination of minerals, polymers and ceramics, forensic trace evidence, organic and inorganic materials, and to differentiate polymorphic forms of active pharmaceuticals. Characterization of carbon nanotubesTriclinic Labs has a NXT FT-Raman module that is interfaced to a Nicolet 6700 FT-IR spectrometer. The FT-Raman module has an Indium Gallium Arsenide (InGaAs) detector and is equipped with a 1064 Nd:YAG laser. We generally do not use the FT-Raman for characterization of carbon nanotubes because the sample spectrum is usually quite poor. Rather, we use our Renishaw inVia Raman microscope for such analyses. The inVia instrument combines a DMLM Leica microscope with a dispersive Raman spectrometer. The instrument is equipped with a 785 nm laser and a charge-coupled detector (CCD). The 785 nm laser allows us to obtain very good data. |
||
| Instrument | Model | Notes: |
| Renishaw
Thermo Ondax |
Dispersive Raman
: inVia Chemical imaging, microsampling, Confocal, 785 nm laser
FT Raman : Thermo FT Micro and macro sampling, 1064 nm laser, Omni v.9.7.46 software with spectral libraries. Low frequency : Ondax THz-Raman® With Probe Stokes and anti-Stokes signals from ±5 cm-1 to 200 cm-1, (or 150 GHz to 6 THz) |
Wiki Reference for Raman spectroscopy

cGMP Analysis Available |

For a mini case study on
Drug Product Content Identification and Component Distribution Using Raman Imaging click here.
Infrared Spectroscopy -
Determine functional groups and chemical identity
| Application AND Technique Description | ||
|---|---|---|
|
This covers a range of techniques, mostly based on absorption spectroscopy. As with all spectroscopic techniques,
it can be used to identify and study chemicals. Samples may be solid, liquid, or gas. The method or technique of
infrared spectroscopy is conducted with an instrument called an infrared spectrometer (or spectrophotometer) to
produce an infrared spectrum. An IR spectrum can be visualized in a graph of infrared light absorbance (or
transmittance) on the vertical axis vs. frequency or wavelength on the horizontal axis.
Infrared spectroscopy exploits the fact that molecules absorb frequencies that are characteristic of their structure. These absorptions occur at resonant frequencies, i.e. the frequency of the absorbed radiation matches the vibrational frequency. The energies are affected by the shape of the molecular potential energy surfaces, the masses of the atoms, and the associated vibronic coupling. |
||
| Instrument Brand | Model | Notes: |
| Various - See FT-IR and IR Imaging | Various Latest Model Instruments |
Wiki Reference for Infrared Spectroscopy
|
Which is better FTIR or Raman?
The key advantage of Raman spectroscopy is that it requires little to no sample preparation while the FTIR method has constraints on sample thickness, uniformity and dilution to avoid saturation. The key advantage to FTIR is the difference of the two methods in dealing with interferenceInfrared Imaging -
Chemical, physical, and distribution information of a sample
| Application AND Technique Description | ||
|---|---|---|
|
Provides chemical, physical and distribution information. Analyze samples as small as 50 microns with no need for
liquid nitrogen. Allows the analysis in reflection and ATR of samples as thick as 20 mm with no need to remove
condenser. Over 20 mm samples can be measured, depending on the overall size.
Chemical imaging, microsampling, 1um resolution, Spectral range 7600-375 cm-1 Collection of data in any sampling mode (transmission, reflection and ATR). Extended range allows inorganics and fillers analysis. Ultra fast imaging speed allows the collection of 1.2 x 1.2 mm image in as low as 20 seconds instead of 4.5 minutes of ultra-fast mapping. Real-time identification of samples with material identification, size, percentage of distribution, and chemical image of particles within an area. |
||
| Instrument Brand | Model | Notes: |
| Thermo |
iN10 MX, Model with
Picta 1.5.141 software |
Reference for IR Imaging |
FT-IR Infrared Spectroscopy -
Identify known and unknown organic and inorganic materials
| Application AND Technique Description | ||
|---|---|---|
|
An FTIR spectrometer simultaneously collects high-spectral-resolution data over a wide spectral range.
This confers a significant advantage over a dispersive spectrometer (e.g. Raman), which measures intensity
over a narrow range of wavelengths at a time. FTIR spectrometers are mostly used for measurements in the
mid and near IR regions. The technique is used to obtain an infrared spectrum of absorption, emission,
photoconductivity or Raman scattering of a solid, liquid or gas for identification. We spectrally match
acquired spectra to our databases of over 1.5 million known compounds.
The term Fourier-transform infrared spectroscopy originates from the fact that a Fourier transform (a mathematical process) is required to convert the raw data into the actual spectrum. Since information from all wavelengths is collected simultaneously. It results in a higher signal-to-noise ratio for a given scan-time. Attenuated total reflectance (ATR) ATR is an accessory used to measure surface properties of solid or thin film samples rather than their bulk properties. Generally, ATR has a penetration depth of around 1 or 2 micrometers depending on your sample conditions. Identification of volatiles. (VOCs)Thermo TGA/IR interface accessory for our Nicolet 6700 IR spectrometer.The gas cell heats to 250 °C and the transfer line goes to 225 °C. The transfer line easily connects to our evolved gas furnace on our TA Q50 TGA. Our TGA setup uses a nitrogen purge, which could be easily switched to helium if needed. The IR is currently equipped with a DTGS detector and OMNIC 9.2 software. |
||
| Instrument Brand | Model | Notes: |
| Thermo |
iS50, Model 60825
Nicolet 6700 ATR, diffuse reflectance, transmission, gas cell, spectral library matching. Omnic 9.7.46 Software |
Wiki Reference for FTIR
cGMP Analysis Available |
UV/VIS -
Quantitative determination of components
| Application AND Technique Description | ||
|---|---|---|
|
Routinely used in analytical chemistry for the quantitative determination of different analytes. The presence
of an analyte gives a response assumed to be proportional to the concentration. UV/Vis can also be applied to
determine the kinetics or rate constant of a chemical reaction.
|
||
| Instrument Brand | Model | Notes: |
| PerkinElmer | Lambda 25 | Wiki Reference for UV/Vis
cGMP Analysis Available |
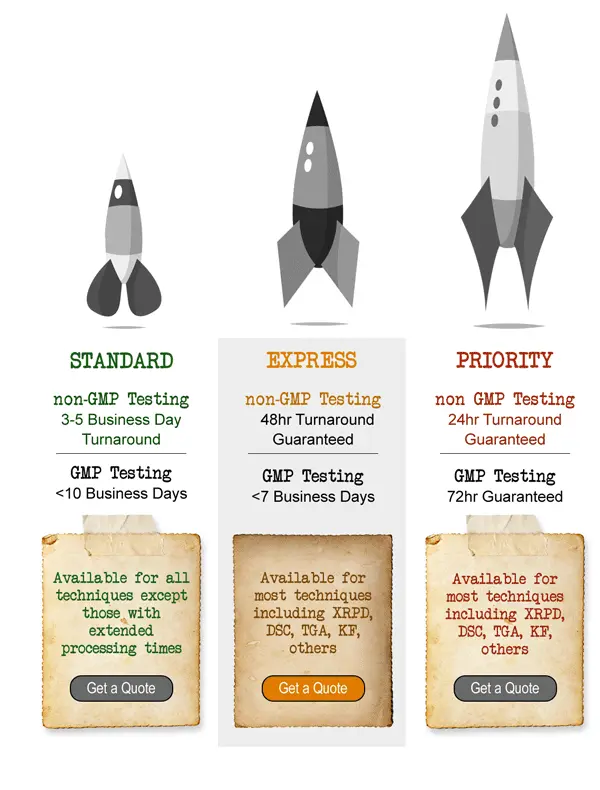
Spectroscopy Service Levels Available: