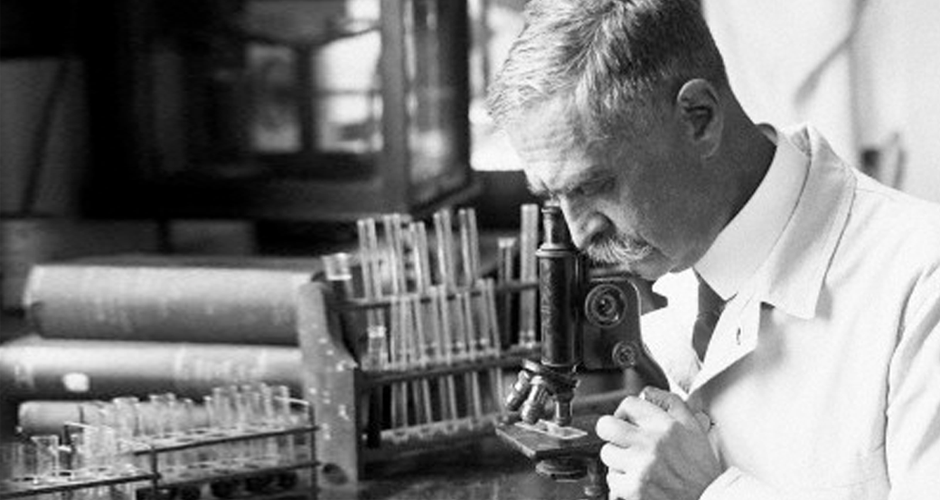
Images become evidence when they explain material behavior
Microscopy can reveal particle shape, crystal habit, agglomeration, inclusions, surface defects, birefringence, and thermally driven changes that bulk analytical methods may overlook. However, visually similar particles can have different chemical identities, and attractive images are not automatically representative of the sample. Triclinic Labs combines optical and polarized-light microscopy with scanning electron microscopy and energy-dispersive X-ray spectroscopy (SEM-EDS/SEM-EDX), elemental mapping, hot-stage microscopy, atomic force microscopy (AFM), and complementary chemical and solid-state techniques. The resulting optical images, spectra, chemical images, and observations are interpreted against representative sample regions and the material decision involving composition, form, processing history, stability, dissolution, or manufacturing performance.
The content of this page has been scientifically reviewed by David Bugay, Ph.D., CSO at Triclinic Labs · Updated 8/1/2026
Overview of SEM-EDS, SEM-EDX and Microscopy Analysis Services
Scientific principle and analytical basis
Microscopy includes optical microscopy, polarized-light microscopy, scanning electron microscopy (SEM), hot-stage microscopy, atomic force microscopy (AFM), infrared (IR) microspectroscopy, and Raman microspectroscopy. These methods visualize particles, surfaces, crystal habit, inclusions, birefringence, thermal behavior, topography, chemical identity, and component distribution.
When is it used?
Use microscopy for contaminant triage, particle-shape analysis, crystal habit, formulation failure, coating defects, agglomeration, birefringence, thermal microscopy, SEM-EDX localization, and morphology-linked process issues.
What are limitations?
Microscopy is local and can be non-representative. Visual similarity does not prove chemical identity or solid form. SEM may require vacuum, coating, microtomy, or other preparation; AFM scans small areas slowly; hot-stage experiments can create artifacts.
What sample amounts are needed?
Amounts can be very small for triage or imaging, but representative sampling may require multiple particles, regions, or lots. SEM-EDX, image analysis, and current good manufacturing practice (cGMP) methods should be scoped against the decision and matrix.
Complementary Techniques
Complementary techniques include X-ray powder diffraction (XRPD), Raman and Fourier-transform infrared (FTIR) microspectroscopy, particle-size analysis, elemental analysis, chromatography, nuclear magnetic resonance (NMR) spectroscopy, and thermal analysis. These methods connect visible morphology and spatial features to chemical identity, solid form, composition, and material behavior.
What does the U.S. Food and Drug Administration (FDA) care about?
FDA cares whether the microscopy method is representative, documented, specific for the stated quality attribute, and supported by orthogonal identity data when the result affects release, investigation, or chemistry, manufacturing, and controls (CMC) decisions.
What are common mistakes?
Common mistakes include selecting only visually interesting particles, ignoring sampling statistics, using images as proof of composition, changing particles during prep, and reporting beautiful images without explaining the development decision.
What is Triclinic's experience with this technique
Triclinic uses microscopy to connect visible particle, crystal, contaminant, and surface features to practical material behavior. Real-world applications include foreign-particle investigations, morphology comparisons, birefringence and crystallinity checks, hot-stage observations, agglomeration or attrition assessments, and SEM/optical evidence that helps explain processing, stability, dissolution, or lot-comparability concerns. Triclinic also performs sample preparation using sledge microtomy and ultramicrotomy. The preparation method, section thickness, and blade material are selected according to the sample, required spatial resolution, and analytical technique.
Specific instruments and capabilities for SEM-EDS, SEM-EDX and Microscopy Analysis
The table below lists the specific platforms, brands, models, software, detectors, and capability notes relevant to this service area.
| Instrument or platform | Brand, model, software, or detector | Additional capabilities and use |
|---|
| Stereo / compound / polarized-light microscopy | Leica M80 stereo microscope; Leica DM2500P compound microscope; polarizing-light microscope; Pax-it2! v.1.4.3 software | Still and dynamic image capture, birefringence, morphology, particle habit, density/color/shape, and optical-path boundary observations. |
| Digital microscopy and topography | Keyence VHX-2000E digital microscope | Still imaging, topography image capture, surface inspection, particle documentation, and visual root-cause support. |
| SEM/EDX | Thermo Phenom XL with fully integrated EDX and backscattered electron (BSE) detector | High-vacuum/low-vacuum SEM imaging, BSE contrast, and integrated elemental analysis for particles and contaminants. |
| Field-emission SEM | FEI Quanta 3D FEG with high-vacuum, low-vacuum, and cryo capability | High-resolution morphology, surface/ultrastructure examination, and cryogenic or low-vacuum imaging workflows. |
| EDX detector system | Oxford INCA PentFETx3 EDX | Elemental spectra, spot/region analysis, and elemental maps for foreign-particle and contaminant investigations. |
| Hot-stage microscopy | Linkam LTS420, ambient to 600 °C | Thermomicroscopy, phase-change observation, melting/recrystallization behavior, and cocrystal/solid-form screening support. |
| Atomic-force microscopy | Hitachi and Park AFM systems, all modes | Nanometer-scale topography and surface-property measurements for small particles and surfaces. |
| Sledge microtomy and ultramicrotomy | Sledge and ultramicrotome sample-preparation systems; steel, glass, or diamond blades selected according to the material | Preparation of controlled micrometer-scale or ultrathin sections for optical microscopy, IR and Raman microspectroscopy, SEM, and other spatially resolved analyses. Section thickness and blade selection are matched to material hardness, sample integrity, and required resolution. |
| Infrared imaging microscopy | Thermo iN10 MX with Picta 1.5.141 software | IR chemical imaging, attenuated total reflectance (ATR)/reflection/transmission measurements, microsampling, and component distribution mapping. |
This example uses polarized-light microscopy as the case-study basis. Microscopy is valuable because it provides visual and spatial evidence that other techniques may average away. It can show morphology, crystal habit, particle size and shape, birefringence, inclusions, surface texture, and sample heterogeneity. The table below summarizes how the observations connect to decisions.
| Microscopy observation | Decision supported |
|---|
| Size and shape | Particle morphology, agglomeration, milling effects, or lot-to-lot comparability. |
| Birefringence / anisotropy | Whether particles behave like crystalline, anisotropic material rather than isotropic glass or amorphous material. |
| Crystal habit and interfacial angles | Habit engineering, solid-form screening, process troubleshooting, or crystal-growth interpretation. |
| Surface texture and transparency / opacity | Contaminant triage, coating defects, failure analysis, or material-comparison questions. |
| Localized particles or inclusions | Selection of regions for follow-up Raman, IR, SEM/EDX, XRPD, or other orthogonal testing. |
Technical Resources and Publications
These examples include technical resources, regulatory guidances, or literature relevant to the technique. Download buttons are placed at the bottom-left of each example.
A Comprehensive Approach for Solid Form Selection in Preclinical Development and Beyond
Author: Melanie Bevill, Chris Seadeek, Nico Setiawan, Shawn Comella, Blaise Mibeck, and Steef Boerrigter
Publication date: November 2023
Abstract: Solid-form screening and selection connect crystallinity, stability, solubility, hygroscopicity, manufacturability, regulatory needs, and IP objectives. Analytical techniques should therefore be selected according to the development decision rather than a fixed instrument list.
Read the resource overview
Download this Application Note
ICH Q2(R2) Validation of Analytical Procedures and ICH Q14 Analytical Procedure Development
Author: International Council for Harmonisation / FDA
Publication date: 2024
Abstract: FDA notes that ICH Q2(R2) and Q14 describe validation and development principles for analytical procedures used to assess drug substance and drug product quality. These guidances frame FDA expectations for specificity, accuracy, precision, range, robustness, lifecycle management, and fit-for-purpose method evidence.
Download
Application of Low-Frequency Raman Spectroscopy to an Isoenergetic Polymorph Study
Author: Triclinic Labs
Publication date: 2019
Abstract: This white paper describes how low-frequency Raman can distinguish polymorphic forms using lattice-mode information not always available in conventional mid-frequency Raman. It supports using Raman as an orthogonal solid-form tool when XRPD, differential scanning calorimetry (DSC), or Fourier-transform infrared (FTIR) spectroscopy are inconclusive.
Read the resource overview
Download this Whitepaper
Characterizes density, flow, particle size, moisture response, surface behavior, and morphology to explain powder handling and manufacturing performance.
View techniqueIdentifies crystalline phases and solid forms, measures crystallinity, and tracks polymorph, hydrate, solvate, or salt changes.
View techniqueDetermines molecular and crystal structures from sub-micron crystals when conventional single-crystal analysis is not practical.
View techniqueMeasures melting, glass transitions, crystallization, solvent loss, and decomposition to connect thermal behavior with stability and processing.
View techniqueQuantifies water, distinguishes bound from surface moisture, and evaluates sorption, desorption, hydrate formation, and humidity-driven change.
View techniqueProvides rapid molecular-identification, functional-group, solid-form, mixture, and spatial-distribution evidence using Raman, FTIR, IR imaging, and UV/Vis.
View technique Common questions
What is the difference between microscopy imaging and SEM-EDS elemental mapping?▾
Optical or electron microscopy images show particle shape, surface features, contrast, defects, inclusions, or spatial relationships. Scanning electron microscopy with energy-dispersive X-ray spectroscopy (SEM-EDS or SEM-EDX) adds localized elemental spectra and maps. Elemental mapping identifies where detected elements occur, but it does not by itself establish molecular identity or solid form.
What sample types are suitable for microscopy and SEM-EDS analysis?▾
Suitable samples can include powders, particles, fibers, residues, films, coatings, device surfaces, inclusions, cross-sections, crystals, tablets, and heterogeneous formulations. Feasibility depends on particle size, sample stability, conductivity, vacuum compatibility, mounting, coating, and whether preparation could alter the feature of interest.
What outputs and limitations should be expected from microscopy analysis?▾
Outputs can include optical or electron images, particle measurements, elemental spectra, elemental maps, selected-region comparisons, and interpretation tied to the project question. Limitations can include sampling representativeness, spatial resolution, elemental detection limits, poor response for some light elements, vacuum or coating effects, and inability to determine molecular identity or solid form without complementary methods such as Raman, Fourier-transform infrared spectroscopy, or X-ray powder diffraction.

Discuss the right analytical technique
Tell Triclinic what sample you have, what decision the data must support, what prior data are available, and whether cGMP, release, validation, or regulatory documentation is required.