
Pharmaceutical Impurity & Degradant Identification
Use accurate-mass, fragmentation, and orthogonal evidence when a low-level chromatographic peak requires structural assignment.

Trace-level findings are often limited less by instrument capability than by sampling, isolation, contamination control, matrix interference, and representativeness. Triclinic scopes these studies by asking where the component is located, how much material is available, whether it is distributed uniformly or heterogeneously, and what level of confidence or quantitation is required.
A trace signal may be a low-level impurity, a single visible particle, a field of microscopic debris, an elemental residue, a polymer fragment, a coating component, a leachable, a catalyst residue, or an unexpected peak. The method must match the form of the evidence.
Trace-level analysis can be limited by the amount of material available, matrix interference, signal localization, and representativeness. A low-level contaminant may appear as a single particle, a surface residue, a small elemental signal, a weak spectral feature, or a low-abundance phase in a mixed sample. The analytical plan should therefore separate detection from interpretation.
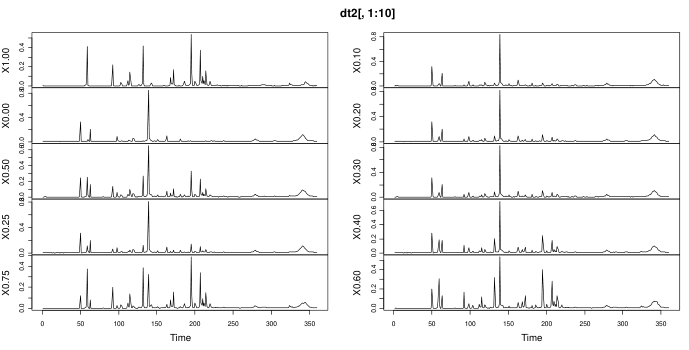
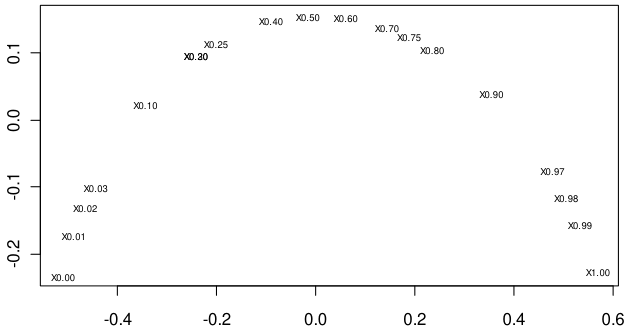
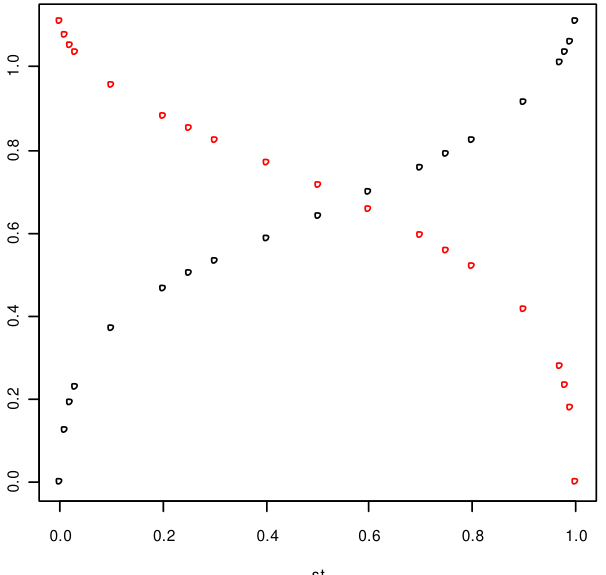
The chemometrics white paper illustrates how pattern-rich data can be used for semi-quantitative phase analysis and pure-curve resolution without relying solely on calibration standards. This is valuable when standard mixtures are not representative of real processed materials, when matrix effects are expected, or when mixed patterns need to be interpreted as an ensemble rather than by a single peak.
| Technique or platform | Information produced | Why it matters |
|---|---|---|
| Optical and digital microscopy | Visual morphology, dimensions, surface features, color, layering, and sample-selection context. | Documents the evidence before destructive testing and helps select specific particles or regions for analysis. |
| Raman microscopy and chemical mapping | Molecular fingerprints and spatial distribution of many APIs, excipients, pigments, polymers, and crystalline components. | Useful for suspect-versus-authentic comparisons, coating/core analysis, layered systems, and localized unknowns. |
| FTIR and IR microspectroscopy | Polymer, organic, excipient, adhesive, fiber, film, and residue identification. | Often strong for particles, fibers, packaging materials, cap liners, label adhesives, and contact-material comparisons. |
| SEM/EDX | High-resolution morphology plus elemental composition and elemental maps. | Critical for inorganic particles, fillers, talc-related signals, metals, corrosion, pigments, and source comparisons. |
| LC/MS, GC/MS, chromatography, NMR, or ICP-MS | Targeted or investigative molecular, volatile/semi-volatile, structural, or trace-element information. | Added when direct microanalysis is not enough or when confirmation, quantitation, or structural assignment is required. |
Use accurate-mass, fragmentation, and orthogonal evidence when a low-level chromatographic peak requires structural assignment.
Use microscopy-guided analysis when the trace material is a discrete particle, fiber, residue, film, or localized domain.
Measure low-level elemental targets and distinguish bulk concentration from localized particle composition.
Investigate low-abundance signals associated with packaging, devices, closures, or other product-contact materials.
The study evaluates blanks, controls, replicate preparations, sample history, instrument background, carryover, matrix interference, and signal behavior. Orthogonal detection or an independent preparation may be needed before treating a weak signal as a real sample component.
Sometimes, but identification and quantification impose different evidence requirements. A component may be measurable with a targeted method before enough structural evidence exists to identify it, or it may be identifiable without a validated quantitative method.
The plan uses suitable containers, tools, blanks, environmental controls, handling procedures, preparation sequences, and comparison materials. Sampling and preparation controls are essential because introduced contamination can be comparable to the signal being measured.
Detection and quantitation limits depend on the analyte, matrix, preparation, instrument response, background variability, and intended decision. Feasibility or method-development work may be required before a defensible limit can be assigned.

Share the sample matrix, available amount, observed signal, expected concentration, blanks and controls, collection and handling history, suspected sources, prior data, and the identification or quantitation threshold the decision requires.