Use molecular vibrations and optical response to identify materials, map components, and build specific methods.
Molecular fingerprints only matter when they answer the right question
Spectroscopic methods are among the fastest analytical techniques available for identifying materials, distinguishing polymorphs, detecting contaminants, and understanding complex formulations. However, successful spectroscopy depends upon selecting the appropriate technique, preparing representative samples, and correctly interpreting spectral information within the context of the material being studied. Triclinic Labs applies Raman spectroscopy, Fourier-transform infrared (FTIR) spectroscopy, infrared (IR) imaging, ultraviolet/visible (UV/Vis) spectroscopy, and complementary analytical methods to solve complex pharmaceutical and materials characterization challenges while generating reliable scientific evidence that supports development, manufacturing, and regulatory decisions.
The content of this page has been scientifically reviewed by David Bugay, Ph.D., CSO at Triclinic Labs · Updated 8/1/2026
Overview of Spectroscopy (Raman, FTIR, IR Imaging, UV/Vis) Services
Scientific principle and analytical basis
Raman spectroscopy, FTIR spectroscopy, and IR imaging measure molecular vibrational information. Raman spectroscopy is often strong for polymorph differentiation and aqueous samples; FTIR is useful for functional groups, material identity, and attenuated total reflectance (ATR) surface analysis; IR imaging adds spatial distribution; UV/Vis spectroscopy measures wavelength-dependent absorbance or transmission to support quantitative concentration measurements, kinetic studies, and optical-response methods.
When is it used?
Use spectroscopy for raw-material identification, polymorph and cocrystal differentiation, contaminant identification, tablet/component mapping, low-level active pharmaceutical ingredient (API) in formulations, counterfeit work, UV/Vis method development and validation, dissolution detection, kinetic studies, quantitative assays, and other method-development work when a spectral fingerprint is specific.
What are limitations?
Fluorescence can interfere with Raman, FTIR can saturate or require thickness/dilution control, spectra may overlap in mixtures, and chemometric models can fail outside their training space. Spectroscopy may need X-ray powder diffraction (XRPD), differential scanning calorimetry (DSC), chromatography, or nuclear magnetic resonance (NMR) spectroscopy for confirmation.
What sample amounts are needed?
Amount depends on spot size, mapping area, matrix, and required detection limit. IR imaging can be applied to very small samples, including features on the order of tens of microns; larger representative material may be required for mapping, validation, or current good manufacturing practice (cGMP) method work.
Complementary Techniques
Complementary techniques include X-ray powder diffraction (XRPD), nuclear magnetic resonance (NMR), chromatography, mass spectrometry, microscopy, and thermal analysis. These methods add crystal-phase, connectivity, quantitative, spatial, or thermal evidence when a spectral fingerprint alone does not resolve the material question.
What does the U.S. Food and Drug Administration (FDA) care about?
FDA cares about method specificity, representative sampling, validated chemometric models where used, robustness to sample preparation and matrix changes, and whether the spectral method is suitable for release, stability, or identity testing.
What are common mistakes?
Common mistakes include using library matches without confirming matrix effects, ignoring fluorescence, overfitting chemometrics, mapping too small an area, and claiming polymorph identity without proving spectral specificity against realistic alternatives.
What is Triclinic's experience with this technique
Triclinic uses spectroscopy for practical material identification, solid-form screening, functional-group confirmation, contaminant comparison, phase mapping, and rapid lot or sample comparisons. Raman, FTIR, IR imaging, and UV/Vis are applied when spectral fingerprints can distinguish materials, support incoming-material or investigation work, or provide orthogonal evidence alongside diffraction, chromatography, microscopy, or thermal analysis. UV/Vis also supports method development and validation, dissolution detection, kinetic studies, quantitative analysis, and analytical problem-solving.
NMR spectroscopy for molecular and solid-state questions
Triclinic Labs performs solution-state and solid-state nuclear magnetic resonance (NMR) spectroscopy, including multinuclear, one-dimensional, two-dimensional, and quantitative NMR (qNMR) experiments. NMR supports molecular structure elucidation, impurity identification, solid-form characterization, quantitative analysis, scientific problem-solving, and analytical method development and validation. It is frequently combined with mass spectrometry, chromatography, diffraction, Raman spectroscopy, and FTIR spectroscopy when a defensible conclusion requires complementary structural evidence.
IR is strongest for vibrations that change molecular dipole moment, while Raman emphasizes vibrations that change molecular polarizability. The methods therefore highlight different bonds and structural environments rather than providing interchangeable spectra. Changes in crystal packing, conformation, hydrogen bonding, salt or cocrystal environment, and hydrate or solvate state can produce different IR and Raman responses. Method selection should be based on the material, the sample matrix, and the likely failure state that must be distinguished.
Method or sampling mode
Useful evidence
Important control
Attenuated total reflectance Fourier-transform infrared (ATR-FTIR)
Rapid functional-group and surface analysis with minimal preparation.
The penetration depth is only several microns, so the surface may not represent the bulk.
Transmission or diffuse reflectance infrared Fourier-transform spectroscopy (DRIFTS)
Powder and bulk vibrational fingerprints using transmission or diffuse-reflectance sampling.
Grinding, pellet pressure, dilution, dehydration, particle size, and scattering can change the spectrum or the material.
Raman spectroscopy
Direct powder analysis, polymorph differentiation, microsampling, and aqueous-compatible measurements.
Fluorescence, laser heating, orientation, focus depth, and matrix overlap can limit specificity.
Raman or IR mapping
Spatial distribution, domain size, component colocalization, coatings, and localized contamination.
The mapped area, spatial resolution, reference spectra, preprocessing, and chemometric model must represent the decision.
Matrix specificity matters: A method that distinguishes forms in neat API may fail in a low-dose tablet, coated product, amorphous dispersion, or excipient-rich matrix. Demonstrate specificity against the selected form, likely failure forms, stressed samples, and the actual product matrix.
Specific instruments and capabilities for Spectroscopy (Raman, FTIR, IR Imaging, UV/Vis)
The table below lists the specific platforms, brands, models, software, detectors, and capability notes relevant to this service area.
Instrument or platform
Brand, model, software, or detector
Additional capabilities and use
Dispersive Raman microscopy
Renishaw inVia Raman microscope with DMLM Leica microscope, 785 nm laser, and charge-coupled device (CCD) detector
Chemical imaging, confocal microsampling, polymorph discrimination, carbon-nanotube characterization, and spatial component mapping.
Micro and macro Raman sampling, reduced fluorescence for selected samples, library matching, and non-destructive molecular fingerprinting.
Low-frequency Raman
Ondax THz-Raman system with probe
Stokes and anti-Stokes signals from +/-5 cm-1 to 200 cm-1, or 150 GHz to 6 THz, for lattice-mode/polymorph-sensitive measurements.
Infrared imaging
Thermo iN10 MX with Picta 1.5.141 software
IR chemical imaging, ATR/reflection/transmission sampling, microsampling, real-time particle identification, and distribution mapping.
FT-IR
Thermo iS50 Model 60825 and Nicolet 6700; ATR, diffuse reflectance, transmission, gas cell; DTGS detector; OMNIC v.9.7.46 software
Functional-group identification, spectral-library matching, gas-cell/thermogravimetric analysis coupled with infrared spectroscopy (TGA-IR) evolved-gas analysis, and organic/inorganic material identification.
UV/VIS
PerkinElmer Lambda 25
Quantitative analyte measurement, kinetic studies, and high-performance liquid chromatography (HPLC)/dissolution detection support where UV response is suitable.
Raman Chemical Imaging and Component-Distribution Example
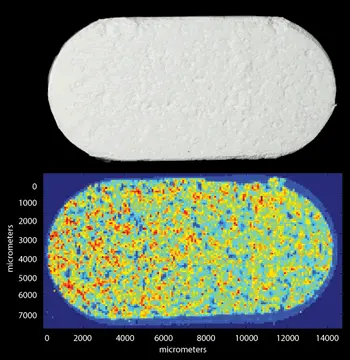
This example shows why spectroscopy can be more than a library match. Raman and IR methods support molecular fingerprinting, polymorph differentiation, contaminant identification, and chemical imaging. Chemical imaging converts many spatially resolved spectra into a map of where components are located within a sample.
A tablet can pass a bulk assay while still containing API-rich or excipient-rich domains. Raman or IR mapping can reveal segregation, domain size, component colocalization, coatings, layered structures, or localized contaminants that may affect dissolution, stability, or content uniformity. When solvent, drying, milling, or compression changes product performance, pre- and post-process spectral comparisons can also indicate altered packing or local bonding, with phase assignments confirmed against suitable references and orthogonal data.
Raman chemical-imaging and component-distribution example. The figure shows how spectral mapping can support questions about blend uniformity, API distribution, layered tablets, microspheres, counterfeit products, or patient-complaint samples. The image is a chemical map rather than a photograph, so interpretation depends on spectral specificity, resolution, sampling area, and data-processing controls. Source: Triclinic Labs spectroscopy and chemical-imaging material.
Technical Resources and Publications
These examples include technical resources, regulatory guidances, or literature relevant to the technique. Download buttons are placed at the bottom-left of each example.
Application of Low-Frequency Raman Spectroscopy to an Isoenergetic Polymorph Study
Author: Triclinic Labs
Publication date: 2019
Abstract: This white paper describes how low-frequency Raman can distinguish polymorphic forms using lattice-mode information not always available in conventional mid-frequency Raman. It supports using Raman as an orthogonal solid-form tool when XRPD, DSC, or FTIR are inconclusive.
Low-Frequency Raman Analysis of Spray-Dried Dispersions
Author: Triclinic Labs
Publication date: April 2023
Abstract: This application note evaluates acetaminophen spray-dried dispersions by dissolution testing followed by post-dissolution X-ray powder diffraction (XRPD) and low-frequency Raman mapping, showing how Raman imaging can connect chemical identity and spatial distribution in formulation-relevant samples.
ICH Q2(R2) Validation of Analytical Procedures and ICH Q14 Analytical Procedure Development
Author: International Council for Harmonisation / FDA
Publication date: 2024
Abstract: FDA notes that ICH Q2(R2) and Q14 describe validation and development principles for analytical procedures used to assess drug substance and drug product quality. These guidances frame FDA expectations for specificity, accuracy, precision, range, robustness, lifecycle management, and fit-for-purpose method evidence.
Common Questions about Raman, FTIR, and IR Imaging
When should Raman be selected instead of FTIR?▾
Raman is often useful for direct powder analysis, aqueous samples, microscopy, and component mapping. FTIR is often useful for functional groups, ATR surface analysis, and materials with strong polar vibrations. Many investigations benefit from both.
Can Raman or IR prove polymorph or hydrate identity?▾
They can when the method is demonstrably specific against realistic alternative forms. Orthogonal confirmation may still be required.
When is chemical mapping more useful than a bulk spectrum?▾
Mapping is appropriate when component distribution, segregation, coatings, domains, or localized contamination may affect the result.
Can sample preparation change the solid form?▾
Yes. Grinding, pellet pressure, dehydration, microtomy, and laser heating can create or obscure the condition being investigated.
Will a method developed for neat API work in a drug product?▾
Not automatically. Excipient overlap, coatings, low API loading, and spatial heterogeneity must be evaluated in the actual matrix.
Is a spectral-library match sufficient for identification?▾
A library match is useful screening evidence, but defensible identification also requires suitable references, matrix specificity, and controlled acceptance criteria.
Tell Triclinic what sample you have, what decision the data must support, what prior data are available, and whether cGMP, release, validation, or regulatory documentation is required.