Particle-Size Distribution Testing and Method Development
Measure particle-size distributions and powder properties that influence flow, dissolution, blending, and manufacturability.
Particle-size data must represent the material—not just the instrument
Particle-size distribution testing can change significantly with dispersion conditions, agglomeration, refractive-index assumptions, obscuration, sample preparation, and the analytical model used to interpret the material. Reporting a single median particle diameter (D50) value can conceal multimodal distributions or particle behavior that affects dissolution, blending, filtration, flow, and product performance. Triclinic Labs develops laboratory particle-size testing and powder-characterization methods using laser diffraction, microscopy, image analysis, morphology, surface-area measurements, and complementary solid-state techniques. Reporting includes the method conditions, distribution behavior, limitations, and interpretation needed for the manufacturing, development, or regulatory decision.
The content of this page has been scientifically reviewed by Nico Setiawan, Ph.D., Analytical Director at Triclinic Labs · Updated 8/1/2026
Overview of Particle-Size Distribution Testing and Method Development Services
Scientific principle and analytical basis
Particle-size analysis measures the distribution of particle dimensions. Laser diffraction reports volume-equivalent spherical diameter distributions; microscopy and image analysis add shape, agglomeration, habit, and particle-identity context.
When is it used?
Use it when particle size affects dissolution, inhalation or suspension performance, blend uniformity, filtration, drying, flow, compaction, coating, lot comparability, or current good manufacturing practice (cGMP) release specifications.
What are limitations?
Laser diffraction assumes optical and shape models and can be sensitive to dispersion, refractive index, agglomerates, bubbles, obscuration, and sample preparation. It does not identify polymorph or chemistry by itself.
What sample amounts are needed?
Amount depends on dry/wet dispersion, concentration, replicate number, and method validation. Instrument ranges do not determine fixed sample amounts; sample needs should be scoped for each product and method.
Complementary Techniques
Complementary techniques include optical microscopy, static image analysis, scanning electron microscopy (SEM), Brunauer-Emmett-Teller (BET) specific surface area, powder-flow testing, X-ray powder diffraction (XRPD), Raman spectroscopy, and dissolution testing. Together they distinguish particle-size effects from shape, surface area, solid form, chemistry, and performance.
What does the U.S. Food and Drug Administration (FDA) care about?
FDA cares whether the particle-size method controls a clinically or manufacturably relevant attribute, whether dispersion conditions are justified, and whether validation covers specificity, precision, robustness, and the intended sample matrix.
What are common mistakes?
Common mistakes include reporting only D50, missing multimodality, breaking or creating agglomerates during prep, choosing the wrong refractive index, ignoring morphology, and assuming particle size explains dissolution without checking form and residual solids.
What is Triclinic's experience with this technique
Triclinic uses particle-size and powder-characterization methods to support real-world decisions about milling, micronization, agglomeration, blending, dissolution, stability, and release specifications. The work is applied when particle size or distribution shape may affect manufacturability, bioavailability, content uniformity, filtration, handling, or lot comparability, and when the method must be appropriate for the material rather than simply reporting a number.
Specific instruments and capabilities for Particle-Size Distribution Testing and Method Development
The table below lists the specific platforms, brands, models, software, detectors, and capability notes relevant to this service area.
Instrument or platform
Brand, model, software, or detector
Additional capabilities and use
Laser diffraction PSD
Malvern Mastersizer 3000 v.3.70 with Malvern Access Configurator v.2.20
Particle-size distribution by volume-equivalent sphere diameter; dry range 0.1-3500 µm and wet range 0.01-1500 µm.
cGMP PSD methods
Malvern Mastersizer 3000 platform with method-development, verification, transfer, validation, and release-testing workflows
Validated particle-size methods, batch release results, and cGMP/non-GMP comparability studies.
Targeted Raman analysis of selected particles to connect particle morphology with chemical identity or composition. This is a scientist-directed microscopy and Raman workflow and should not be interpreted as automated analysis of every detected particle.
Powder flow
Hall FlowMeter AS-300
Flow-rate and apparent-density measurements for powders where PSD affects processability.
Optical and digital morphology
Leica M80, Leica DM2500P, Keyence VHX-2000E, and Pax-it2! v.1.4.3 software
Particle-shape, agglomeration, habit, and topography observations to complement laser diffraction.
Scanning electron microscopy with energy-dispersive X-ray spectroscopy (SEM/EDX) morphology
Thermo Phenom XL SEM/EDX and FEI Quanta 3D FEG
High-resolution particle morphology and elemental confirmation for particles, contaminants, and agglomerates.
Laser Diffraction Particle-Size Distribution Example
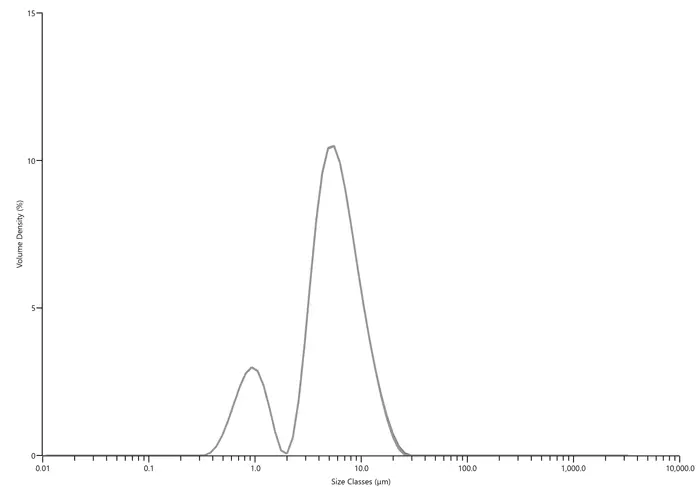
This example shows how particle-size distribution data should be interpreted as a distribution, not a single number. In laser diffraction, a dispersed sample scatters light at angles related to particle size. The resulting distribution can support wet or dry method development, cGMP release testing, method verification, method transfer, and troubleshooting when particle size affects performance or processability.
Laser diffraction particle-size distribution example. The figure reports a volume-density distribution. D10, D50, D90, and D[4,3] may summarize the curve, but they do not replace inspection of the full distribution. Multimodality, fines, aggregates, dispersion conditions, and method settings can change how a powder filters, flows, dissolves, blends, or passes a specification. Source: Triclinic Labs particle-size characterization material.
Technical Resources and Publications
These examples include technical resources, regulatory guidances, or literature relevant to the technique. Download buttons are placed at the bottom-left of each example.
A Comprehensive Approach for Solid Form Selection in Preclinical Development and Beyond
Author: Melanie Bevill, Chris Seadeek, Nico Setiawan, Shawn Comella, Blaise Mibeck, and Steef Boerrigter
Publication date: November 2023
Abstract: Solid-form screening and selection connect crystallinity, stability, solubility, hygroscopicity, manufacturability, regulatory needs, and IP objectives. Analytical techniques should therefore be selected according to the development decision rather than a fixed instrument list.
ICH Q2(R2) Validation of Analytical Procedures and ICH Q14 Analytical Procedure Development
Author: International Council for Harmonisation / FDA
Publication date: 2024
Abstract: FDA notes that ICH Q2(R2) and Q14 describe validation and development principles for analytical procedures used to assess drug substance and drug product quality. These guidances frame FDA expectations for specificity, accuracy, precision, range, robustness, lifecycle management, and fit-for-purpose method evidence.
Application of Low-Frequency Raman Spectroscopy to an Isoenergetic Polymorph Study
Author: Triclinic Labs
Publication date: 2019
Abstract: This white paper describes how low-frequency Raman can distinguish polymorphic forms using lattice-mode information not always available in conventional mid-frequency Raman. It supports using Raman as an orthogonal solid-form tool when XRPD, differential scanning calorimetry (DSC), or Fourier-transform infrared (FTIR) spectroscopy are inconclusive.
Provides rapid molecular-identification, functional-group, solid-form, mixture, and spatial-distribution evidence using Raman, FTIR, IR imaging, and UV/Vis.
How is the appropriate particle-size measurement method selected?▾
Method selection starts with the material, expected size range, morphology, matrix, agglomeration behavior, available quantity, and the decision the result must support. Laser diffraction is useful for distribution measurements, while microscopy or image analysis may be needed when shape, individual particles, or agglomerates affect interpretation.
When should wet dispersion be used instead of dry dispersion?▾
Wet dispersion is useful when the material can be suspended without dissolving, swelling, reacting, or changing form and when the liquid helps control agglomeration. Dry dispersion avoids solvent effects and may better represent some powders, but dispersion pressure can break agglomerates or fragile particles. The method should document why the selected preparation represents the intended material state.
What makes a particle-size method fit for purpose?▾
A fit-for-purpose method has a defined intended use, representative sampling, justified preparation and dispersion conditions, suitable optical settings, adequate range and sensitivity, repeatable results, and demonstrated robustness. Reporting should address the full distribution, multimodality, agglomeration, and method limitations rather than relying on a single D50 value.
Discuss the right analytical technique
Tell Triclinic what sample you have, what decision the data must support, what prior data are available, and whether cGMP, release, validation, or regulatory documentation is required.